DATA EXPLORATION
Each sampling unit corresponds to an individual tree. The predictor variables are the climatic variables for that specific stand/location (average monthly precipitation, average monthly temperature). The response variable is tree ring width measured in millimeters. In total, 341 individual chronologies from 128 different locations were analyzed (Figure 4). Histogram of temperature and precipitation colored by species demonstrates how species occupy different niches (Figures 5-6). Scatter plots were plotted to visualize if there was any apparent relationship between the climate variables and tree ring width (Figures 7-8). These indicated possible correlations between variables and tree rings of the same year what indicate that these species do not follow the same pattern as those reported to be influenced by previous year conditions. Otherwise no correlation would be found.
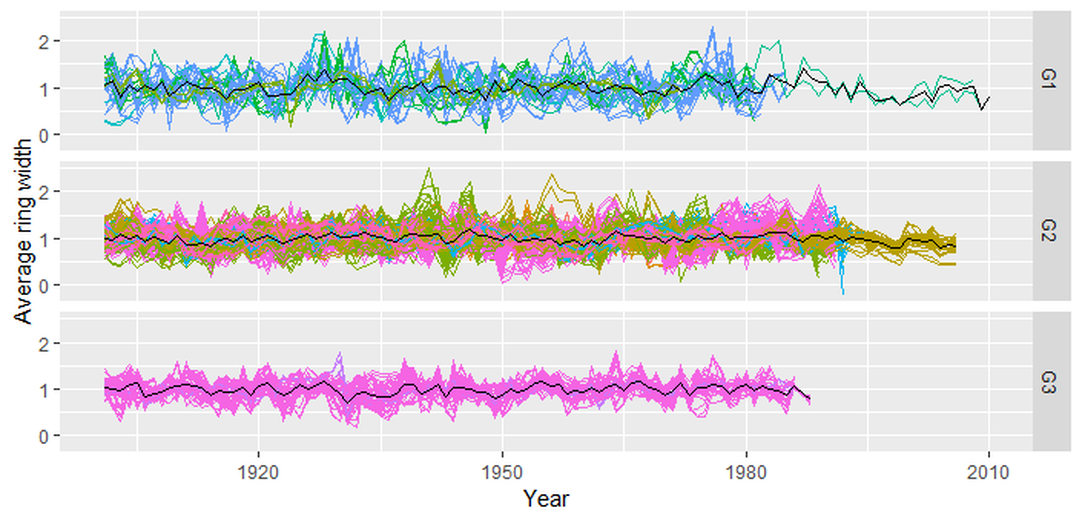
Figure 4. Chronology of all sampled individuals divided by geographical region. Different colors represent different species and the black line represents the average growth ring for the entire geographical region.
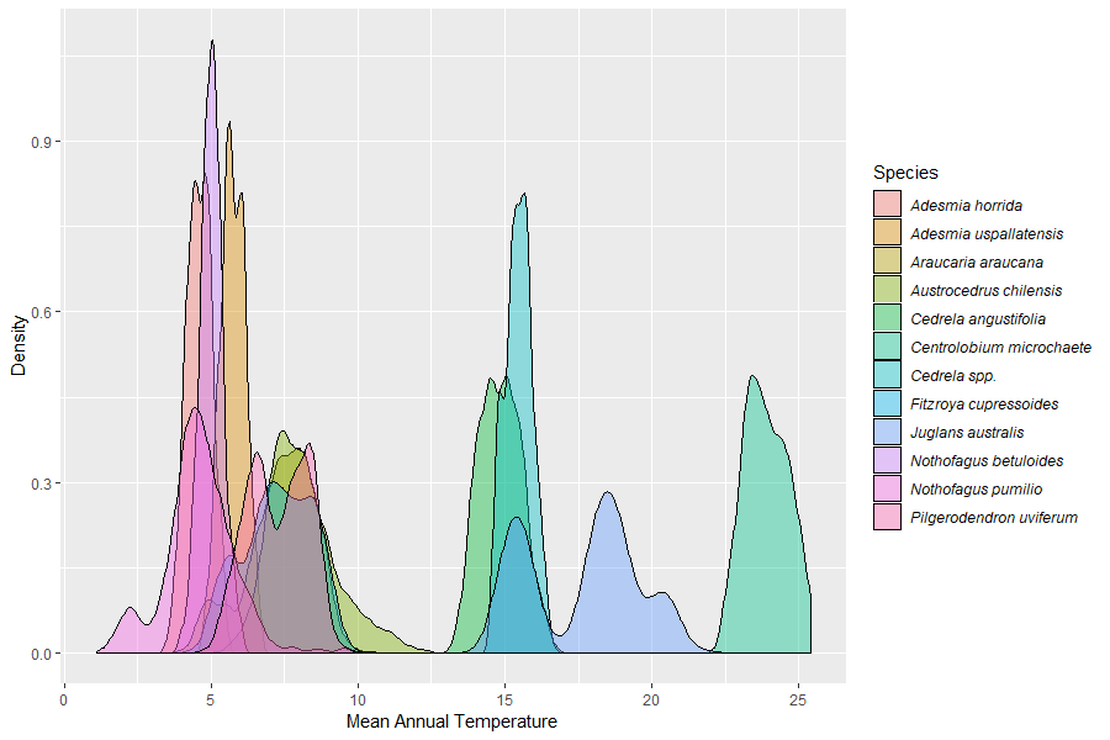
Figure 5. Histogram of the mean annual temperature records for all observations. Some difference is observed for the different species.
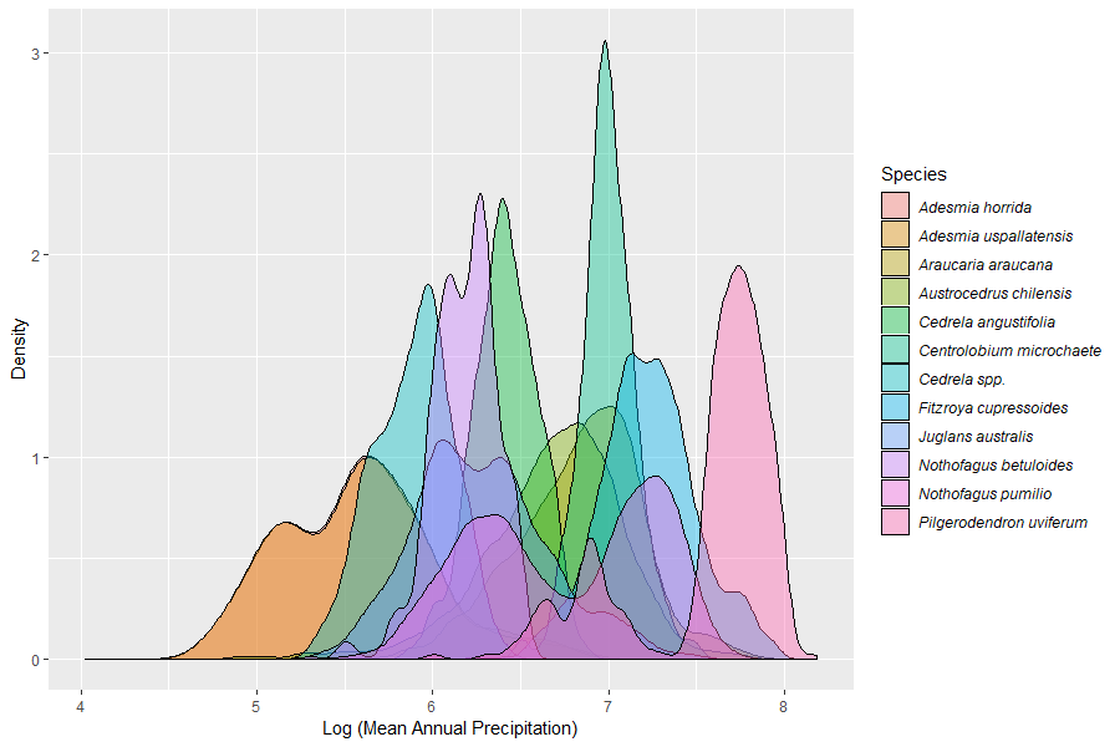
Figure 6. Histogram of the mean annual precipitation records (logarithm) for all observations. Different species occupy different ranges.
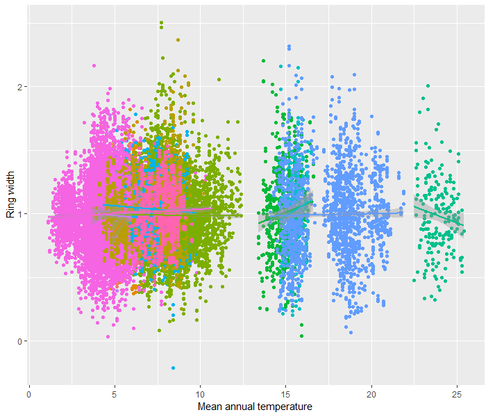
Figure 7. Scatter plot linear correlations between ring width and mean annual precipitation. Different color means different species. Some weak correlations are observed for some species indicating possible response function relationship.
|
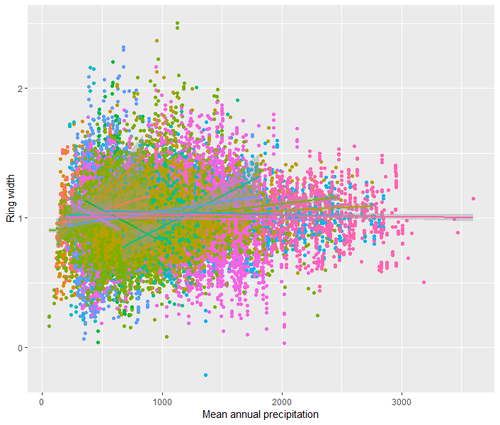
Figure 8. Scatter plot linear correlations between ring width and mean annual temperature. Different colors means different species. Some weak correlations are observed for some species indicating possible response function relationship.
|
