TREE RING
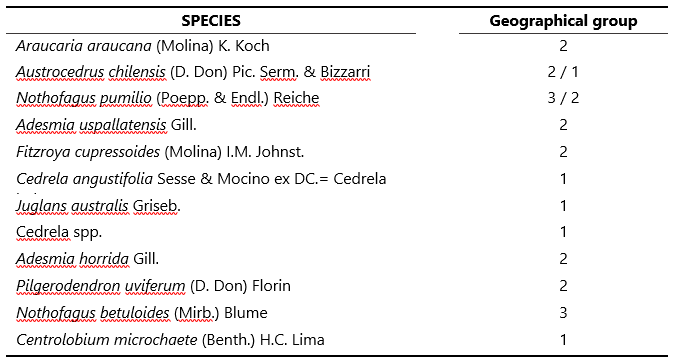
Tree ring information was collected from the International Tree Ring Database made available by the National Oceanic and Atmospheric Administration (NOAA). Chronology files (.crn) were used to correlate tree ring width and climate information (Figure 3). Each file contains values of tree ring width (measure of growth in millimeters) for a single species that covers hundreds of years (Table 1). These tree samples have also already been cross dated to assure that each individual ring accurately corresponds to the year actual year of growth. Although sampled trees can be more than 300 hundred years old, only measurements starting from 1901 were used. This is the earliest date that we can found climate data. Files were analyzed with R Studio software Version 1.1.456 using the “dplR” package to read .crn files. In total, 12 species were sampled (Table 2)
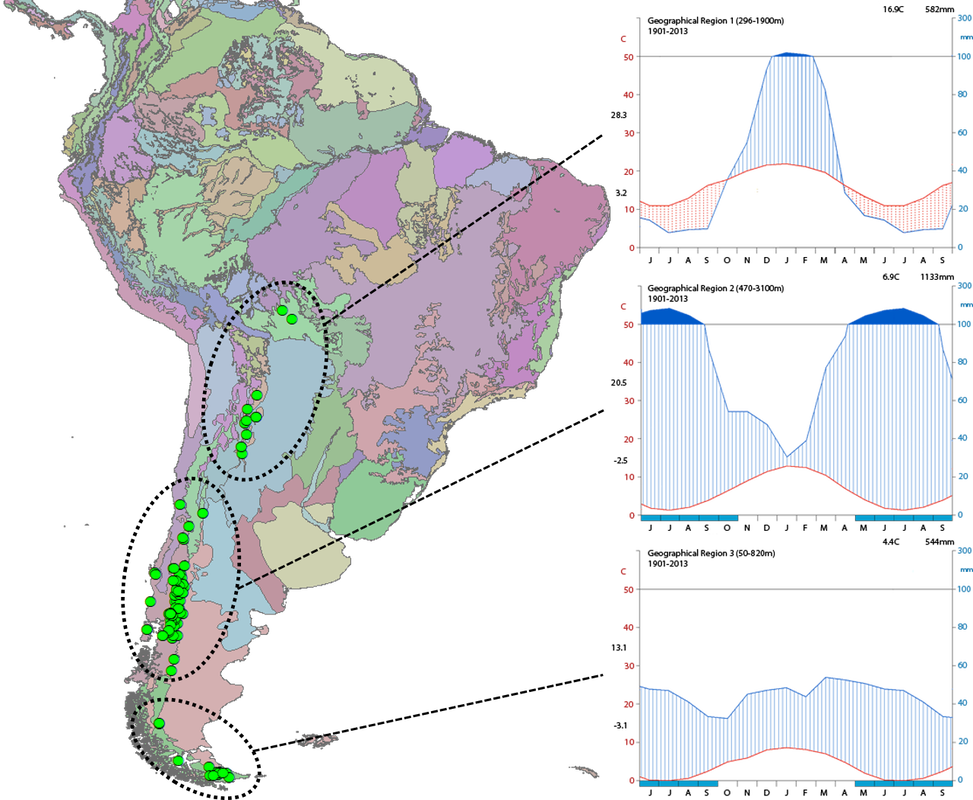
Figure 3. Map of South America showing sampled points (green circles). Colored subdivision represent the different ecological regions observed. Although there are several ecological regions within the sampled area, climate could be generally grouped into three patterns as indicated by the dotted circles. Climate diagrams following Walter and Lieth standards show the elevation range for each geographical group, mean annual temperature, mean annual precipitation, average maximum monthly temperature (blue line) and average minimum monthly temperature (red line). Blue vertical lines indicate wet periods and dotted red lines indicate drought. Blue squares along the x axis indicate months with frosts. For the function analysis response the diagrams were modified to start on June of the previous year and end in September of the current year.
Table 1. General appearance of a chronology file (.crn). The first column indicates the file ID. After the header - first three lines - each line corresponds to a decade of tree ring measurements in millimeters.
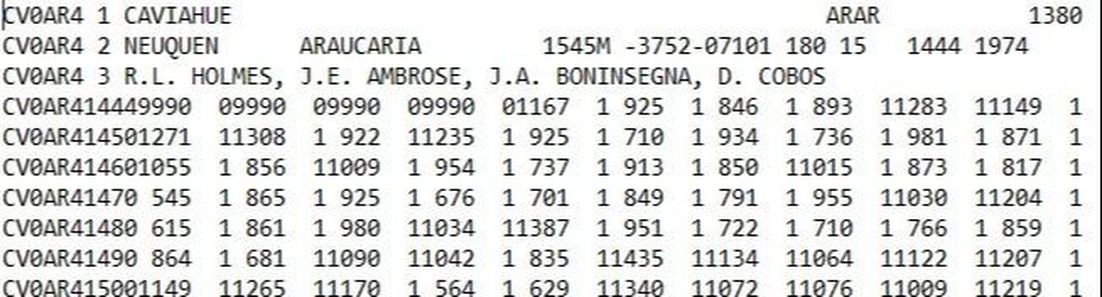
Table 2. List of the 12 sampled species and the geographical group they were found.
CLIMATE
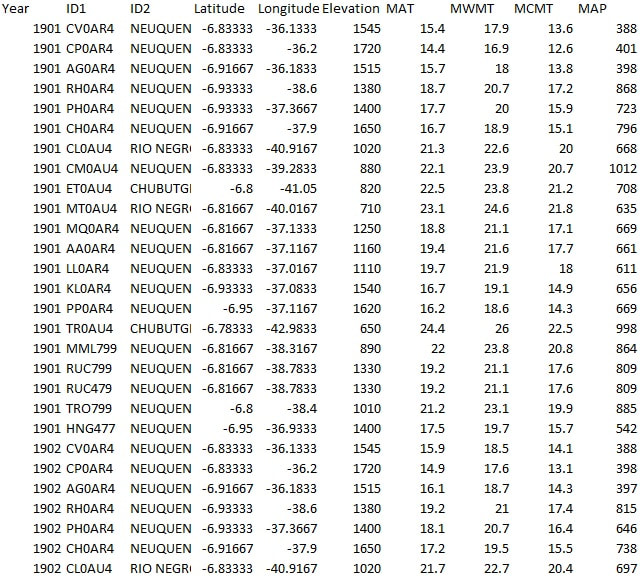
Climate information was collected with the ClimateSA software v1.12 for each of the chronology locations starting from the year 1901. This is the earliest available date to collect climate data. Generated tables were imported into R software for subsequent correlation (Table 3). Although several ecological regions can be distinguished based on vegetation assemblage and other parameters, three main climatic patterns were identified upon analyzing climate diagram of the samples. They were hypothesized to reflect similar growth conditions for the species within the same geographical region and thus similar limiting factors.
Table 3. Generated through the software ClimateSA. By inputting Coordinates and elevation into the software, it returns all the desired values for every location for the given period.
STATISTICAL ANALYSIS
For the response function analysis, the average ring width of each year was correlated with monthly averages of climate variables – precipitation and temperature – for each individual. Since trees can respond even a year later to environmental conditions, correlations started in June of the previous year up to September of the same year of the recorded growth. All the computations were done using the R packages dplR version 1.6.6(Bunn et al., 2012) and treeclim version 2.0.0 (Zang & Biondi, 2016).
