RESULTS & DISCUSSION
The three analyzed geographical regions shows contrasting climate conditions in terms of mean annual precipitation and temperature and also in term of period of dry season. The G1 region have its dry period during the winter, whereas G2 shows the opposite with the dry period in the summer. The G3 region show more mild and stable conditions throughout the year. The results of all correlations are plotted in (Figure 9).
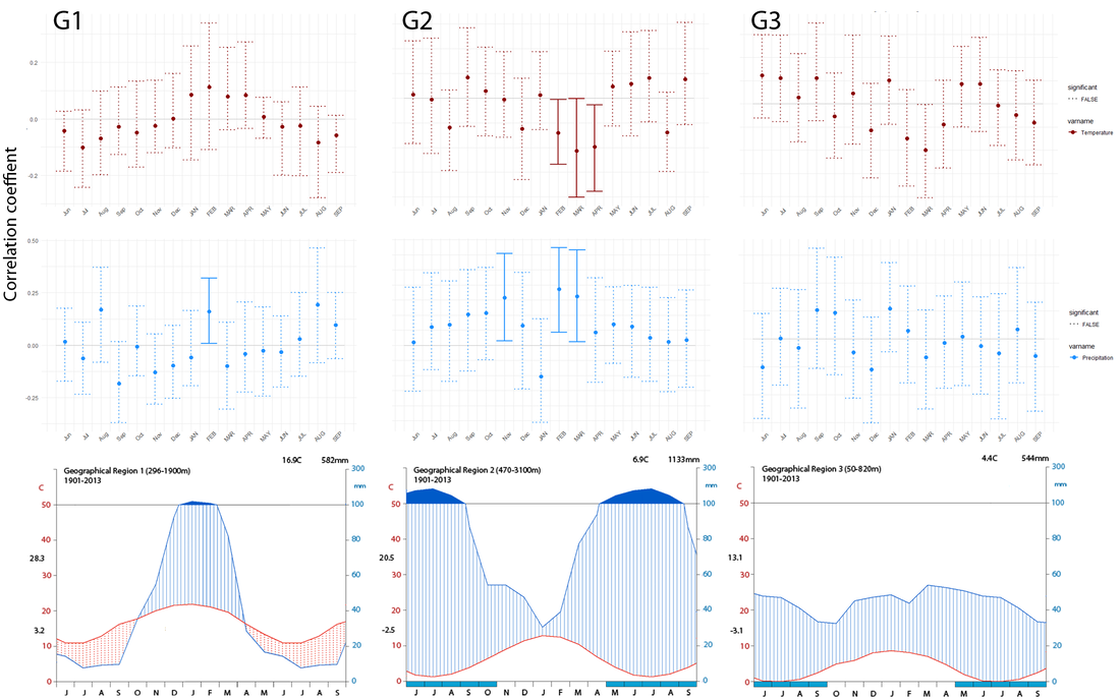
Figure 9. Response function analysis for the three geographical regions analyzed. Correlation coefficients and climate diagrams are align vertically for better visualization correlations. Correlation coefficients in red represent temperature and in blue precipitation. G1 = geographical region 1 (north region), G2 = geographical region 2 (south of G1), G3 = geographical region 3 (south).
The three analyzed geographical regions shows contrasting climate conditions in terms of mean annual precipitation and temperature and also in term of period of dry season. The G1 region have its dry period during the winter, whereas G2 shows the opposite with the dry period in the summer. The G3 region show more mild and stable conditions throughout the year.
For the G1 precipitation seems like the most important factor contributing for tree growth with a positive correlation with February precipitation of the same year. For that group this results demonstrate that although the drought period is more pronounced, species in this region might be well adapted to these conditions benefiting from increasing precipitation of the summer period.
Although temperature does not show significant correlations, there is an apparent trend of increasing correlation coefficient with temperature during the summer month of February too. This shows that for the G1 region, the previous year have no influence in tree ring growth.
For G2, temperature showed a negative correlation with the months of February, March and April of the same year. These month corresponded to the end of the drying period and might indicate that, at the of the drying season species could be at the limit of drought and increasing temperatures during this period have a direct negative effect on the growth. Also, a positive correlation was found for December of the previous year and February and March of the same year. This reinforces the sensitive of this region to drought periods and demonstrates this region as the most vulnerable of the ones studied. Embolism caused by increasing temperatures and low precipitation might be the reason for that.
As for the G3 group no correlation was observed as expected. The mild and stable conditions of this region were not thought to imposed limiting factors for the species there, mostly because temperature are lower – what limits transpiration – and precipitation is constant – thus not subjecting species to water deficits in any part of the year.
